plotCsvData
Usage
Tracer les données observées et/ou prévues sous forme graphique
usage: plotCsvData [-h] [-C {grp16,grp18,grp20,grp22,pyspc}] [-c CFG_FILENAME]
                   [-n {EH,EJ,HH,HI,HU2J,P15m,P3H,P5m,P6m,PH,PJ,PM,QH,QI,QJ,QM,TH,TI,TJ,VH,VI,ZH,ZI}]
                   [-t {event,hydro,hydro_limni,hyeto,reservoir,subreach}]
                   [-F FIRST_DTIME] [-I INPUT_DIR] [-L LAST_DTIME]
                   [-O OUTPUT_DIR] [-v] [-w] [-s STATION_NAME |
                   -l STATIONS_LIST_FILE]
Named Arguments
- -C, --csv-type
Possible choices: grp16, grp18, grp20, grp22, pyspc
Format de fichier csv
Default:
'pyspc'- -c, --config-filename
[optionnel] Nom du fichier de configuration. Si défini, les autre options sont ignorées
- -n, --varname
Possible choices: EH, EJ, HH, HI, HU2J, P15m, P3H, P5m, P6m, PH, PJ, PM, QH, QI, QJ, QM, TH, TI, TJ, VH, VI, ZH, ZI
Nom de la variable à extraire
- -t, --plot-type
Possible choices: event, hydro, hydro_limni, hyeto, reservoir, subreach
Type de figure
- -F, --First-datetime
Premier pas de temps de la série de données (aaaammjj[HH])
- -I, --Input-directory
Dossier d’entrée des données GRP
- -L, --Last-datetime
Dernier pas de temps de la série de données (aaaammjj[HH])
- -O, --Output-directory
Dossier de sortie
- -v, --verbose
[optionnel] Mode verbeux (defaut=False)
- -w, --warning
[optionnel] Mode Avertissement (defaut=True). Si False, ne lève pas les erreurs lors de la création et lors de la manipulation des séries de données
- -s, --station-name
Identité de la station
- -l, --station-list
Fichier contenant la liste des stations Hydro. Non pris en compte si l’option -s est utilisée
Exemples
Note
Les exemples sont issus des tests unitaires.
Création de la figure selon le fichier de condiguration data/_bin/plotCsvData/cfg/event.txt.
plotCsvData.py -c data/_bin/plotCsvData/cfg/event.txt
[figure]
plottype = event
dirname = data/_bin/plotCsvData/out
filename = event
verbose = False
dpi = 150
format = png
title = Evenement nov. 2014
xtitle = temps
xlim = 2014110100,2014111000
xfmt = d/m/YnH:M
xminor = 0,25,6
ytitlep = prcp ($mm.h^{-1}$)
ytitlet = temp ($Celsius$)
ytitleq = debit ($m^3.s^{-1}$)
ylimp = 0,30
ylimt = -5,20
ylimq = 0,200
legend = 0
lfontsize = 8
xfontsize = 8
yfontsize = 8
tfontsize = 12

[defaut]
inputdir = data/_bin/plotCsvData/in/event
firstdatetime = 2014110100
lastdatetime = 2014111000
color = 0.0,0.0,0.0
linewidth = 2
linestyle = -
marker =
markersize = 4

[K0403010_QH]
color = 0.2,0.6,1.0
label = Chambon (Q)

[43091005_PH]
color = 1.0,0.0,0.4
label = LES ESTABLES (P)

[43091005_TH]
color = 1.0,0.6,0.6
label = LES ESTABLES (T)

[43130002_PH]
color = 0.0,0.4,0.0
label = MAZET-VOLAMONT (P)

[43130002_TH]
color = 0.4,1.0,0.4
label = MAZET-VOLAMONT (T)
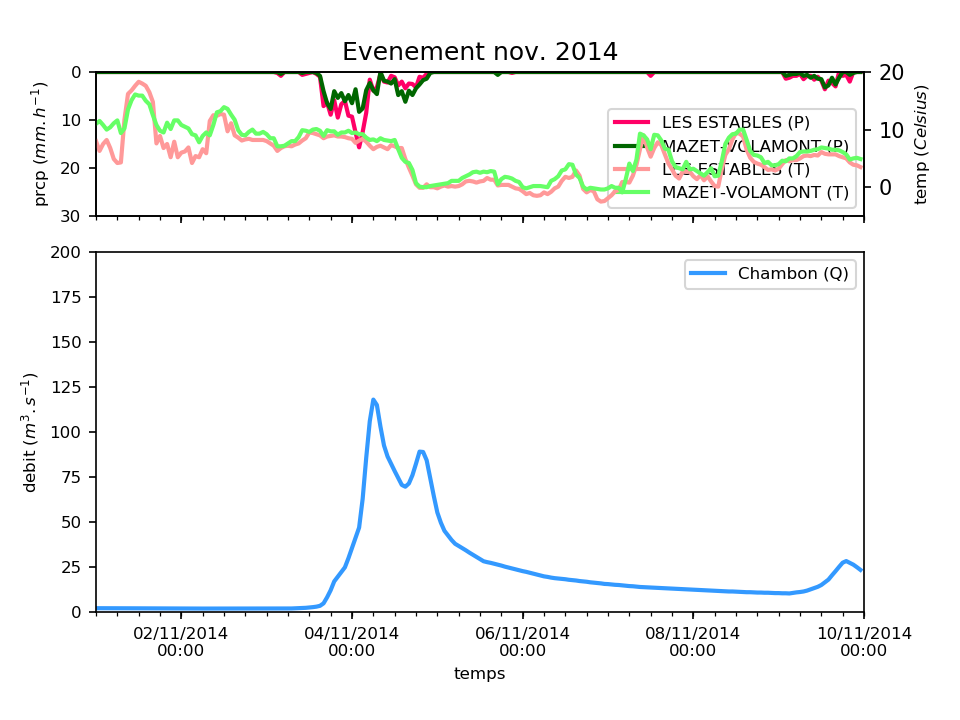
Figure event.png
Création de la figure selon le fichier de condiguration data/_bin/plotCsvData/cfg/hydro.txt.
plotCsvData.py -c data/_bin/plotCsvData/cfg/hydro.txt
[figure]
plottype = hydro
dirname = data/_bin/plotCsvData/out
filename = hydro
verbose = False
dpi = 150
format = png
title = Hydrogrammes
xtitle = temps
xlim = 2008103100,2008110323
xfmt = d/m/YnH:M
xminor = 0,25,6
ytitle = Hauteur (m)
legend = 2
lfontsize = 8
xfontsize = 8
yfontsize = 8
tfontsize = 12

[defaut]
inputdir = data/_bin/plotCsvData/in/hydro
firstdatetime = 2008103100
lastdatetime = 2008110323
color = 0.0,0.0,0.0
linewidth = 2
linestyle = -
marker =
markersize = 4

[K0260020_QH]
label = Chadrac
color = 0.4,0.6,1.0

[K0550010_QH]
label = Bas-en-Basset
color = 0.0,0.0,0.4
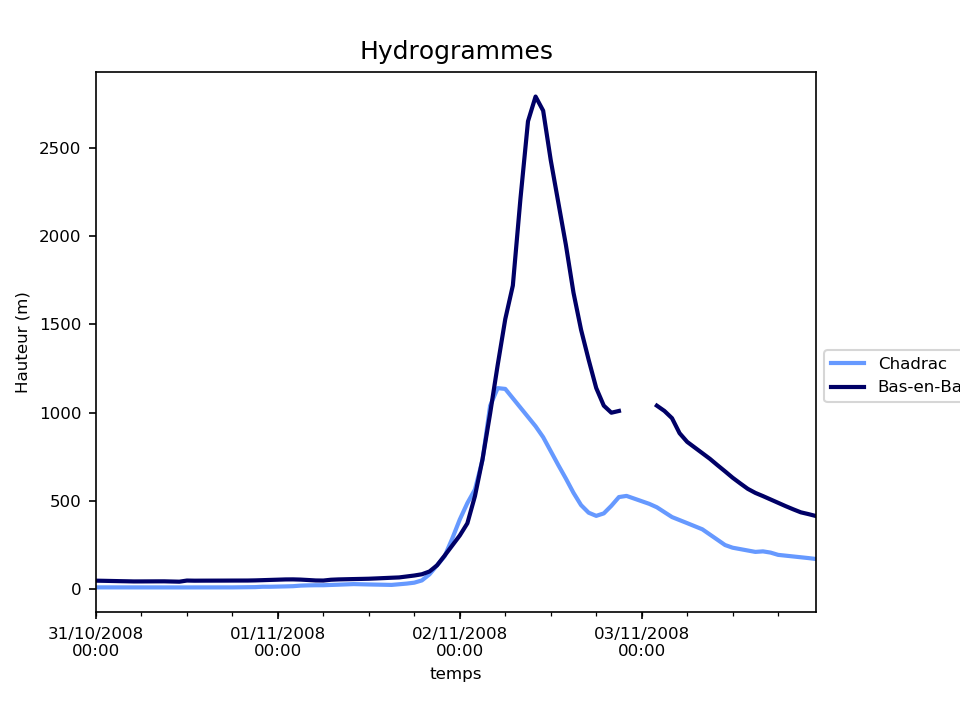
Figure hydro.png
Création de la figure de type hydro à partir des données au format pyspc des séries listées dans data/_bin/plotCsvData/in/chadrac_bas.txt pour la grandeur QH sur la période du 2008103100 au 2008110323. Les données sont lues depuis le répertoire data/_bin/plotCsvData/in/hydro et la figure est créée dans le répertoire data/_bin/plotCsvData/out.
plotCsvData.py -I data/_bin/plotCsvData/in/hydro -l data/_bin/plotCsvData/in/chadrac_bas.txt -n QH -F 2008103100 -L 2008110323 -O data/_bin/plotCsvData/out -C pyspc -t hydro
Fichier de stations : data/_bin/plotCsvData/in/chadrac_bas.txt
K0260020
K0550010
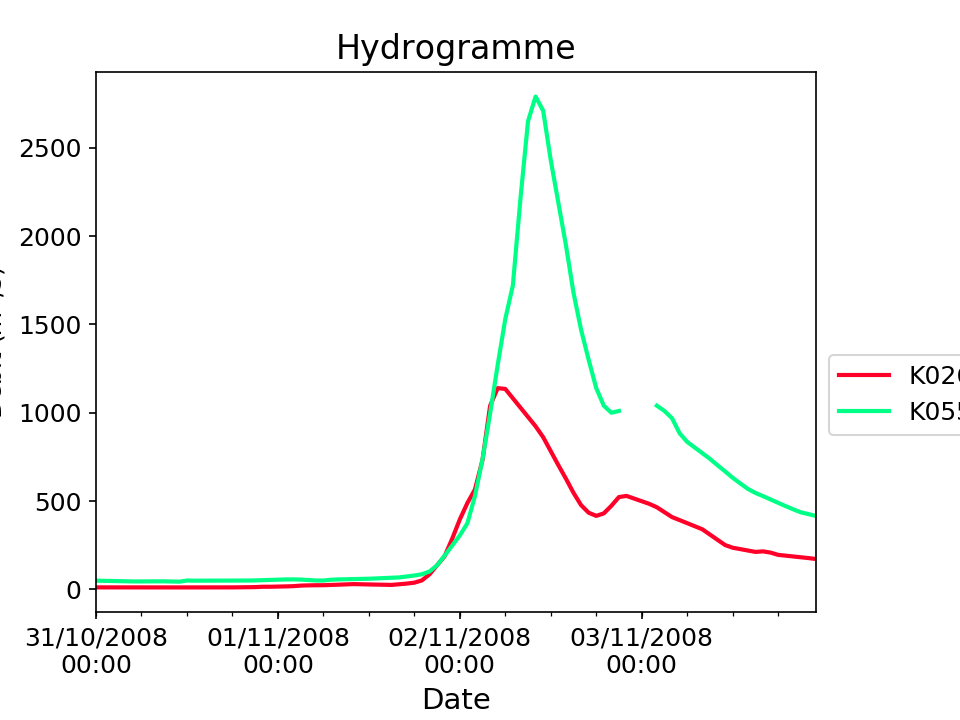
Figure chadrac_bas_2008103100-2008110323.png
Création de la figure selon le fichier de condiguration data/_bin/plotCsvData/cfg/hydrolimni.txt.
plotCsvData.py -c data/_bin/plotCsvData/cfg/hydrolimni.txt
[figure]
plottype = hydro_limni
dirname = data/_bin/plotCsvData/out
filename = hydrolimni
verbose = False
dpi = 150
format = png
title = Bas
xtitle = temps
xlim = 2008103100,2008110500
xfmt = d/m/YnH:M
xminor = 0,25,6
ytitle1 = debit ($m^3.s^{-1}$)
ytitle2 = hauteur ($m$)
legend = 0
lfontsize = 8
xfontsize = 8
yfontsize = 8
tfontsize = 12

[defaut]
inputdir = data/_bin/plotCsvData/in/hydrolimni
firstdatetime = 2008103100
lastdatetime = 2008110500
color = 0.0,0.0,0.0
linewidth = 2
linestyle = -
marker =
markersize = 4

[K0550010_HH]
label = Bas (H)
color = 0.4,0.6,1.0

[K0550010_QH]
label = Bas (Q)
color = 0.0,0.0,0.4
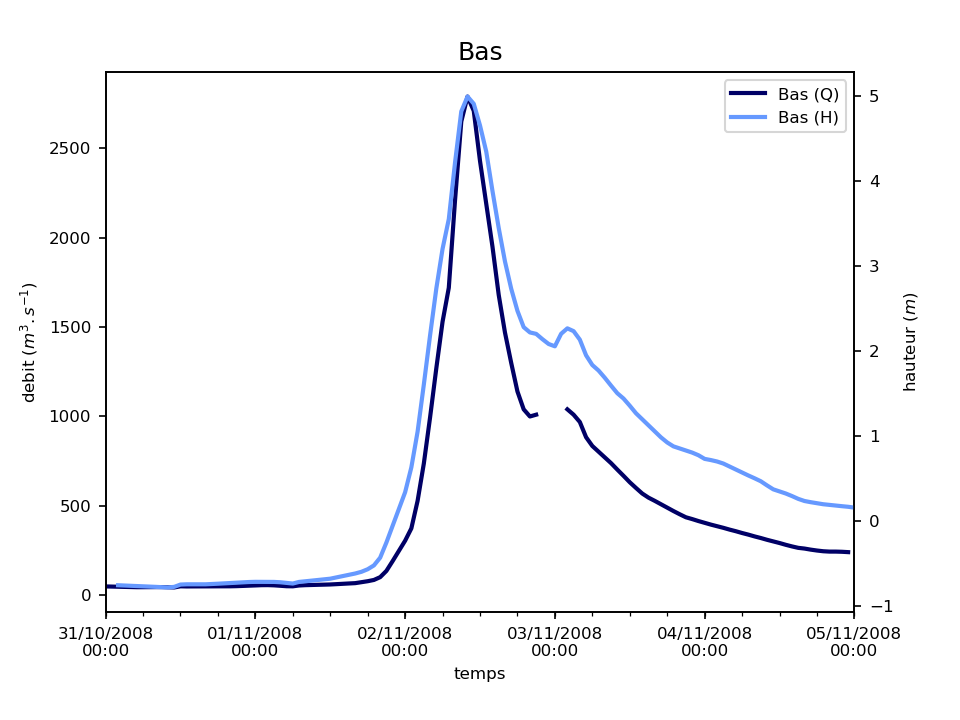
Figure hydrolimni.png
Création de la figure selon le fichier de condiguration data/_bin/plotCsvData/cfg/hyeto.txt.
plotCsvData.py -c data/_bin/plotCsvData/cfg/hyeto.txt
[figure]
plottype = hyeto
dirname = data/_bin/plotCsvData/out
filename = hyeto
verbose = False
dpi = 150
format = png
title = Haut bassin de la Loire
xtitle = temps
xlim = 2014110100,2014111000
xfmt = d/m/YnH:M
xminor = 0,25,6
ytitle = prcp ($mm.h^{-1}$)
legend = 0
lfontsize = 8
xfontsize = 8
yfontsize = 8
tfontsize = 12

[defaut]
inputdir = data/_bin/plotCsvData/in/hyeto
firstdatetime = 2014110100
lastdatetime = 2014111000
color = 0.0,0.0,0.0
linewidth = 1
linestyle = -
marker =
markersize = 4

[43091005_PH]
label = LES ESTABLES
color = 0.2,0.6,1.0
facecolor = 0.2,0.6,1.0

[43130002_PH]
label = MAZET-VOLAMONT
color = 1.0,0.0,0.4
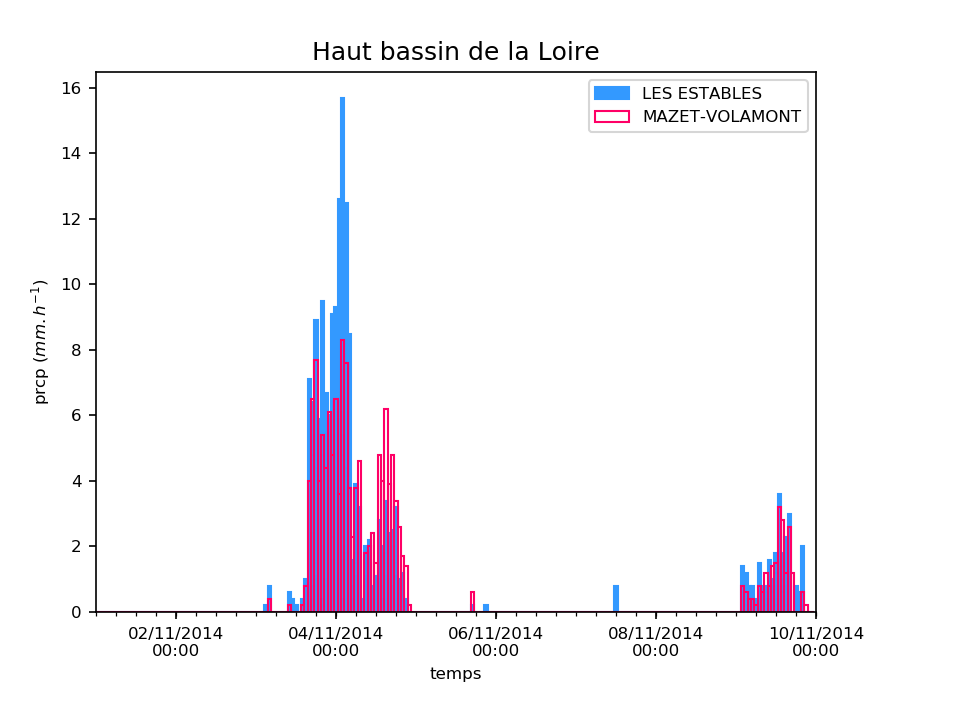
Figure hyeto.png
Création de la figure selon le fichier de condiguration data/_bin/plotCsvData/cfg/reservoir_H.txt.
plotCsvData.py -c data/_bin/plotCsvData/cfg/reservoir_H.txt
[figure]
tfontsize = 14
xtitle = temps
xlim = 2016112001,2016112800
plottype = reservoir
lfontsize = 8
title = Lignon du Velay
format = png
ytitlez = hauteur relative ($m$)
xfontsize = 8
xminor = 0, 25, 6
xfmt = d/m/YnH:M
dirname = data/_bin/plotCsvData/out
verbose = False
ytitleq = debit ($m^3.s^{-1}$)
filename = reservoir_H
legend = 0
dpi = 150
yfontsize = 8

[defaut]
firstdatetime = 2016112001
color = 0.0,0.0,0.0
linestyle = -
lastdatetime = 2016112800
linewidth = 1
markersize = 0
marker =
inputdir = data/_bin/plotCsvData/in/reservoir

[K0403010_QH]
color = 0.2,0.2,0.2
label = Chambon-sur-Lignon

[K0433020_HH]
color = 0.2,0.2,0.6
label = La-Valette

[K0433030_HH]
color = 1.0,0.2,0.0
label = La-Chapelette

[K0433030_QH]
color = 0.8,0.0,0.0
label = La-Chapelette sortant
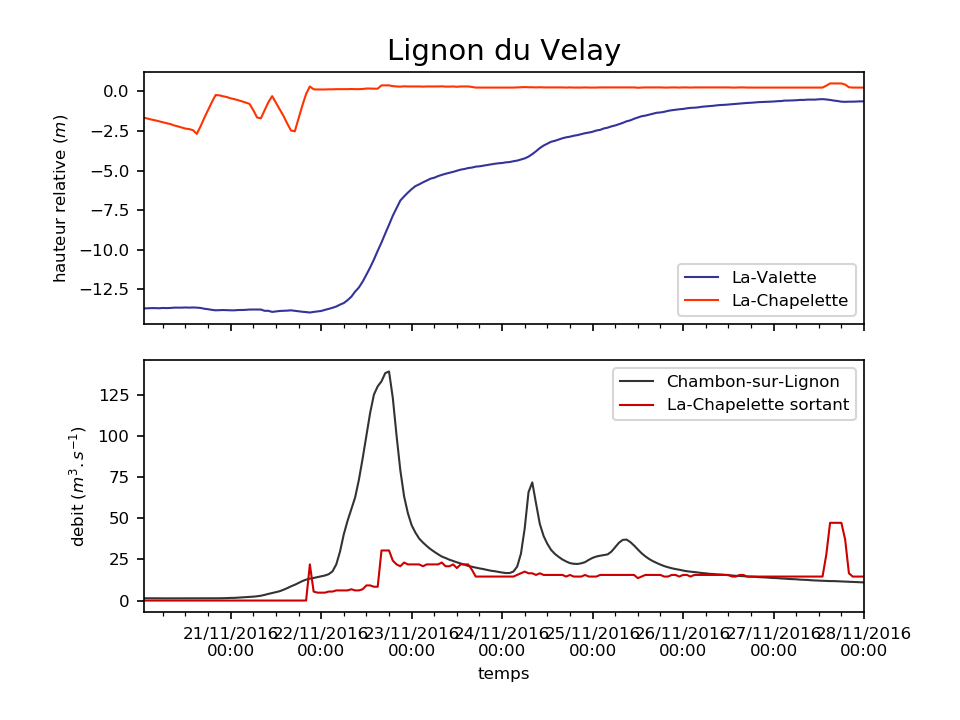
Figure reservoir_H.png
Création de la figure selon le fichier de condiguration data/_bin/plotCsvData/cfg/reservoir_Z.txt.
plotCsvData.py -c data/_bin/plotCsvData/cfg/reservoir_Z.txt
[figure]
tfontsize = 14
xtitle = temps
xlim = 2016112001,2016112800
plottype = reservoir
lfontsize = 8
title = Grangent
format = png
ytitlez = cote ($mNGF$)
xfontsize = 8
xminor = 0, 25, 6
xfmt = d/m/YnH:M
dirname = data/_bin/plotCsvData/out
verbose = False
ytitleq = debit ($m^3.s^{-1}$)
filename = reservoir_Z
legend = 0
dpi = 150
yfontsize = 8

[defaut]
firstdatetime = 2016112001
color = 0.0,0.0,0.0
linestyle = -
lastdatetime = 2016112800
linewidth = 1
markersize = 0
marker =
inputdir = data/_bin/plotCsvData/in/reservoir

[K0550010_QH]
color = 0.2,0.2,0.2
label = Bas-en-Basset

[K0600010_ZH]
color = 0.2,0.2,0.6
label = Grangent

[K0600010_QH]
color = 0.2,0.6,1.0
code = K0600010
label = Grangent sortant
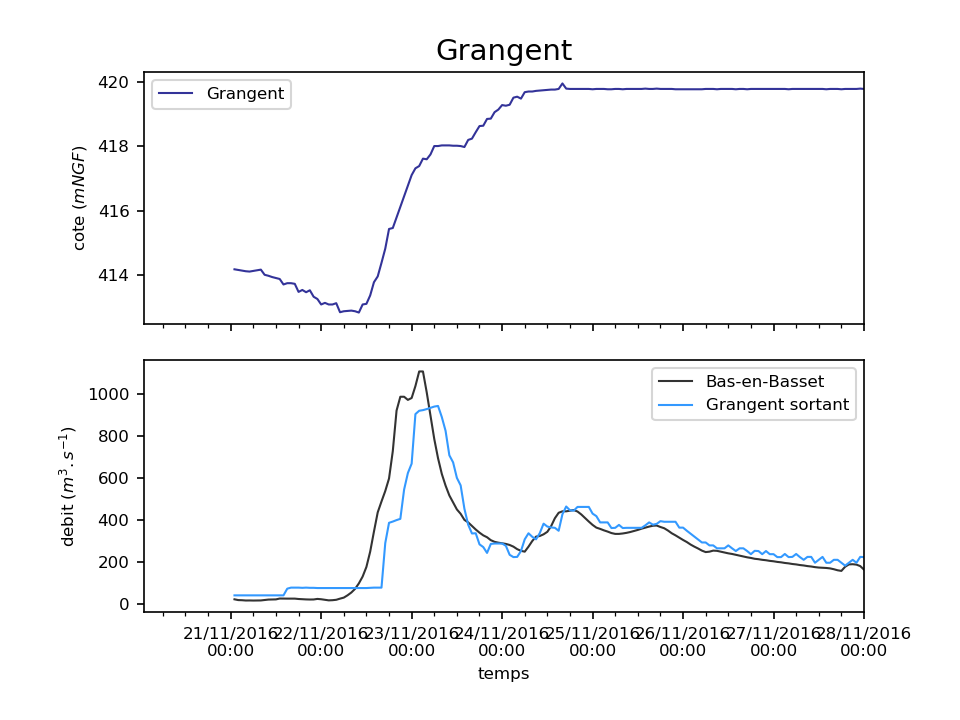
Figure reservoir_Z.png
Création de la figure selon le fichier de condiguration data/_bin/plotCsvData/cfg/subreach.txt.
plotCsvData.py -c data/_bin/plotCsvData/cfg/subreach.txt
[figure]
plottype = subreach
dirname = data/_bin/plotCsvData/out
filename = subreach_aron
verbose = False
dpi = 150
format = png
title = Evenement mars 2020
xlim = 2020030400,2020031000
xtitle = temps
xfmt = Y-m-dnH:M
xminor = 0,25,6
ytitlep = précip. ($mm.h^{-1}$)
ytitleq = débit ($m^3.s^{-1}$)
ytitleh = hauteur ($m$)
legend = 4
lfontsize = 8
xfontsize = 8
yfontsize = 8
tfontsize = 10

[defaut]
inputdir = data/_bin/plotCsvData/in/subreach
firstdatetime = 2020030400
lastdatetime = 2020031000
color = 0.0,0.0,0.0
linewidth = 1
linestyle = -
marker =
markersize = 4

[K1773010_QH]
color = tab:blue
label = Verneuil (Q)

[K177301001_HH]
color = tab:cyan
label = Verneuil (H)

[58267004_PH]
color = tab:red
label = SAINT-SAULGE-SPC

[58306001_PH]
color = tab:orange
label = VERNEUIL-SPC
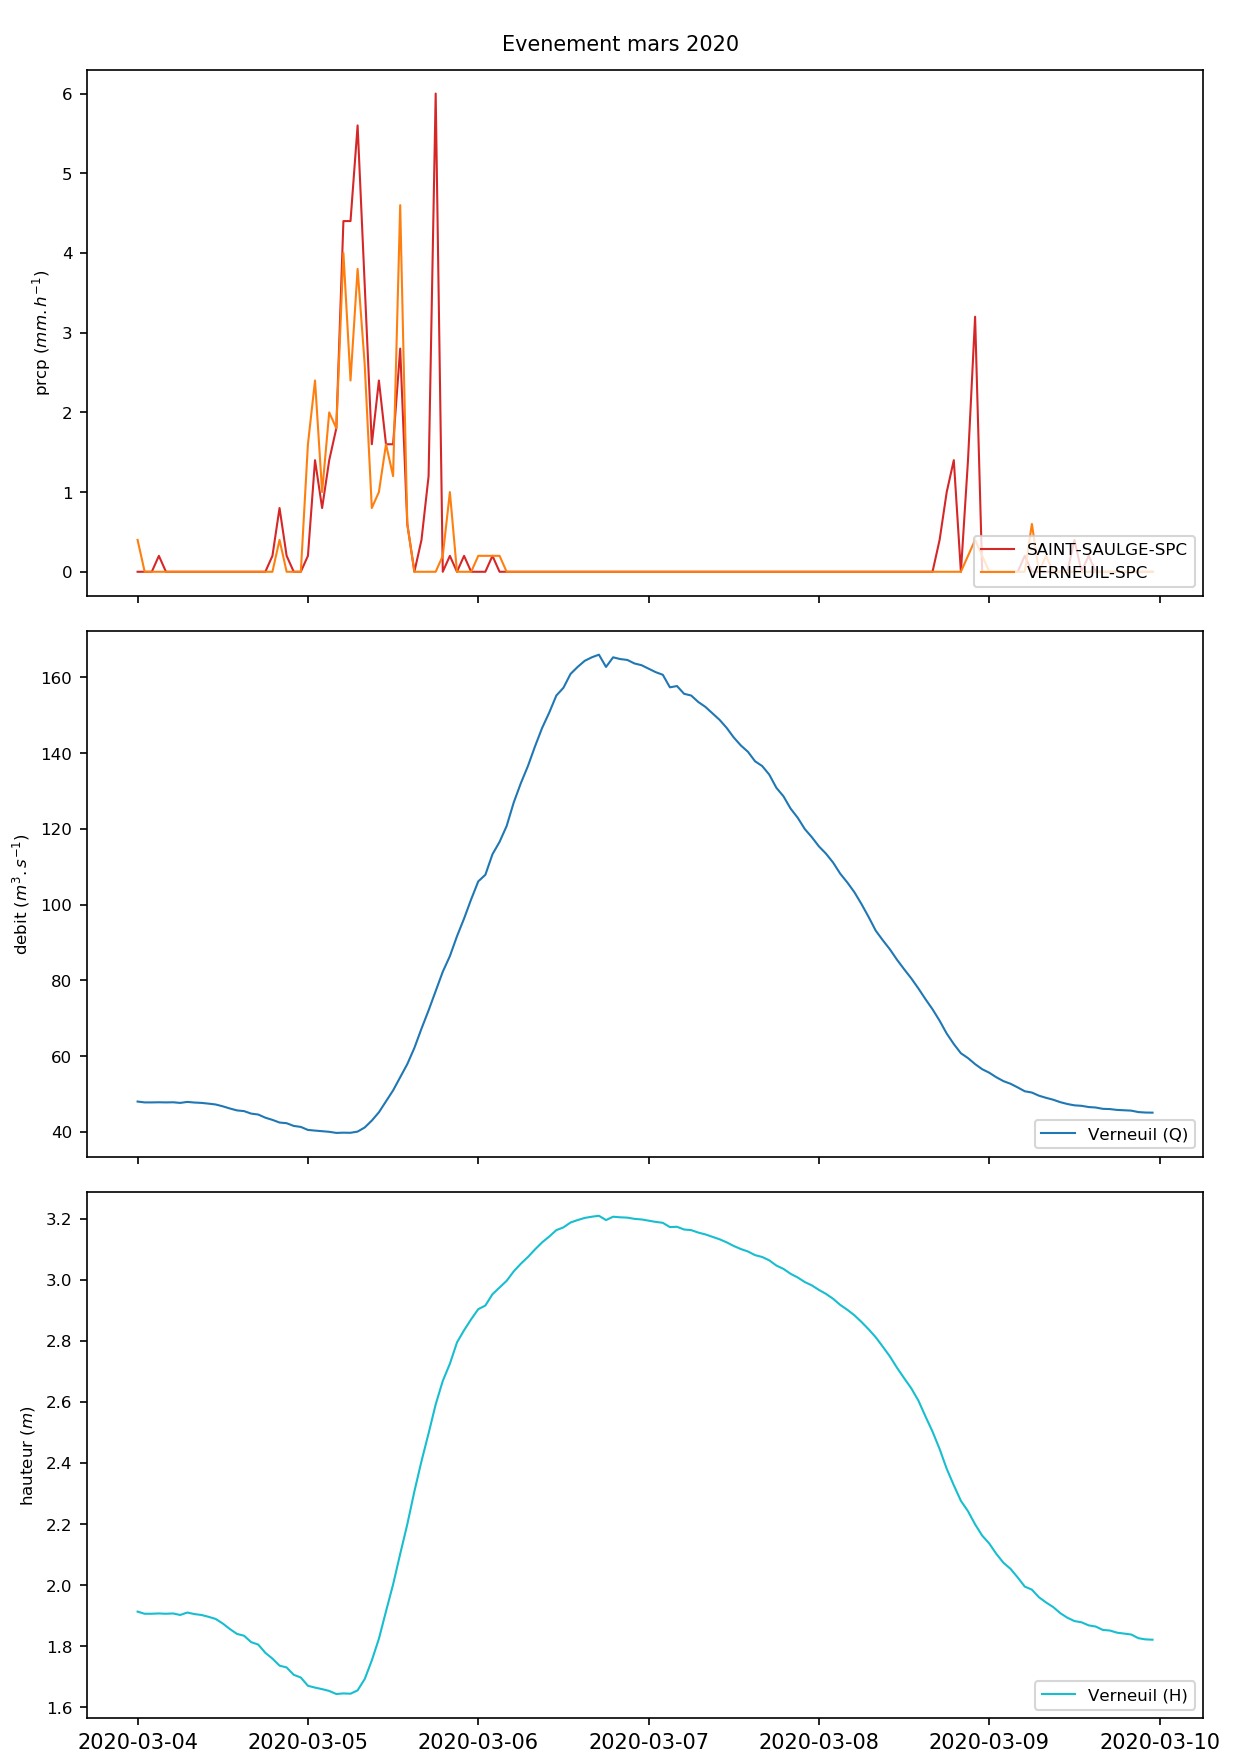
Figure subreach_aron.png